
Ages ago, as part of my research on bombing, I drew attention to Bomb Sight a remarkable digital mapping project that provided a detailed spatial inventory of the Blitz in London in 1940-41.
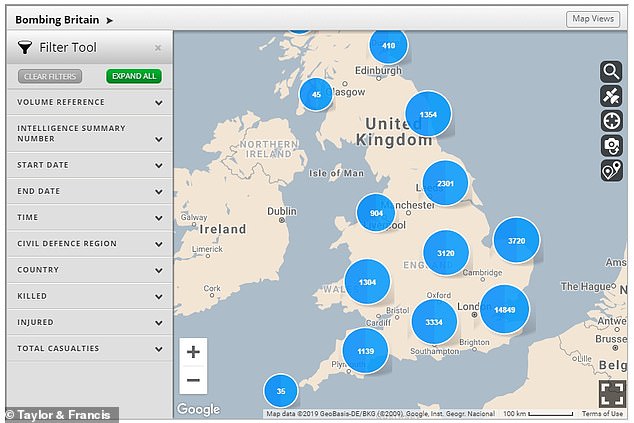
At long last there is the equivalent for the U.K. throughout the war: the digital platform War, State & Society has hosted a zoomable and searchable map (see screenshot above) produced by Laura Blomvall showing 32,000 German air raids on the United Kingdom between September 1939 and March 1945. The first air raid of the war was 80 years ago today – 16 October 1939 – when the Luftwaffe attacked the Firth of Forth near Edinburgh.
Laura’s accompanying open-access essay is here.

An extract (referring to the map above):
When digitally mapped, the density and spread of pinned locations communicate in seconds the scale of devastation these volumes document over thousands of pages. Viewing the data in a single-color heat map format, the entire United Kingdom appears dyed in intense red, with the South East looking like an intense scarlet lake. When the heat map measures numbers of casualties instead of numbers of air raids, the picture changes to show different patterns of numerical density: Belfast, which did not show as a hot spot for air raids, shows as a hot spot for casualties; the county of Kent, a zone of heavy aerial bombardment in the first heat map, disappears as a significant location for casualties next to cities like London, Liverpool, Birmingham, Coventry, Glasgow, and Bristol. In some ways, the correlation between numbers of casualties and urban centers with dense populations seems hardly ground-breaking. However, as a tool for communicating instantaneously what [Juliet] Gardiner called “the macabre taxonomy of war” – a ranking of British cities by casualty numbers – Bombing Britain is unique and unparalleled.
