There have been many maps tracking the course of military and paramilitary violence in Syria. They include general ‘situation maps’ like this one from Canada’s National Post early last year (and whatever I think about the politics of the paper, its graphics are often outstanding):
Or this one from the New York Times on 12 March 2013 (and, as Brian Harley would have been the first to remind us, the very titles of the maps tell their own stories of uncertainty, sympathy and affiliation: but ‘Map of the dispute in Syria’? I understand ‘conflict’, ‘civil war’, ‘uprising’ – but ‘dispute‘?!).
Other sites have tried to capture the fluidity of the situation through a series of updated though largely conventional maps, like Political Geography Now‘s maps of ‘rebel activity’ here and a very different, quite remarkable series of ‘military maps’ here (though as far as I can see no information on sources is provided). The BBC‘s ‘Mapping the Conflict’ interactive is here and its earlier attempts at ‘Mapping the Insurgency’ are here. Relief Web‘s bi-weekly mapped updates on the refugee crisis are all here.
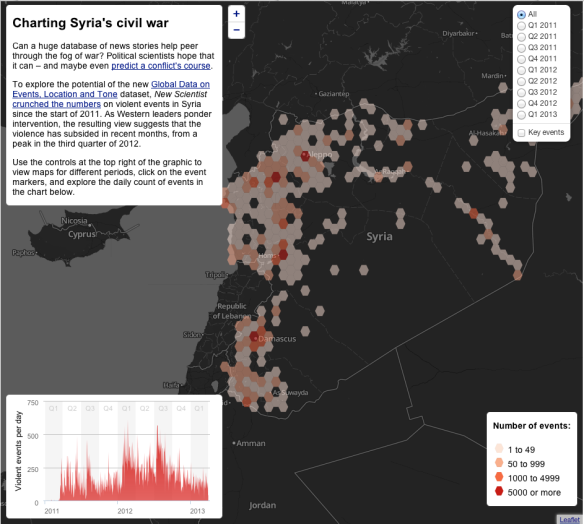
Some of the most imaginative crowd-sourced maps are provided by Syria Tracker here (and more on the project’s data mining and crowd sourcing from iRevolution here). One of the most ambitious interactive projects, reported by the Guardian and master-minded by the New Scientist, is this one, which uses the open-source QGIS to extract and locate violent events recorded on the new Global Data on Events, Location and Tone database (though, for reasons that will be obvious to most geographers, the hexagons give me another pause for unquiet thought); you can access the interactive via the NS here:
All of these maps suffer from inevitable imperfections and deficiencies of data, and they all process and manipulate what they have in different ways (not least by the boundaries they draw around their maps: see this more porous map of the internationalization of the war from Foreign Policy).
We all surely know that none of these representations can be innocent – which brings me to other, more specific mapping projects, like this crowd-sourced map of rape as a military weapon from Women under siege; the live, interactive map is here.
You can find a detailed discussion of the project up to July 2012 by the project’s director Lauren Wolfe here (and an excellent interview here):
‘To step back from the red dots on our map and try to understand the sexualized violence of Syria’s war, our team of doctors, activists, and journalists has taken the 81 stories we’ve gathered so far, from the onset of the conflict in March 2011 through June 2012… Many more victims are included in these reports, but the vagueness of much of the information does not allow us to give an estimate of the total number…. Our data, though largely anecdotal, gives us a sense of the scope and impact of sexualized violence in Syria. It appears to be widespread, not limited to any particular city, and often involves rape.
“The data we have so far suggest sexualized violence is being used as a tool of war, although possibly haphazardly and not necessarily as an organized strategy,” said Dr. Karestan Koenen, associate professor of epidemiology at the Mailman School of Public Health at Columbia University and the lead epidemiologist on the mapping project. “These reports indicate that post-conflict intervention will need to address the consequences of sexualized violence for victims.”
More on that and the possibilities of what we might call forensic cartography from Laura Bates at Open Democracy here:
The crowdmap may serve another vital function in the future, when the information might be used to help drive prosecutions and bring perpetrators to justice. Wolfe hopes that collecting these reports now will give us a base from which to pursue more detailed investigations on the ground post-conflict “to turn our documentation into evidence that could be used in future war crimes trials”. This is vital when dealing with a crime which carries so much stigma that “stories are usually gathered after the fact, when much has been lost to shame and the destruction of evidence.”
Another potential instance of forensic cartography is this map from Human Rights Watch of sites where, despite denials by the Syrian Army, there is evidence of cluster bombs being used (more here):
Apart from the forensic possibilities, all of this must seem desperately depressing – so many violent deconstructions of the material map – but a Syrian activist, Omar al Assil, has produced a map (of sorts – it’s a web of associations, technically a force-directed graph: plotting physical locations of activists would obviously be inviting reprisals) of non-violent activism in Syria; you can read about it courtesy of Amnesty International here and check out the interactive here. Incidentally, unless it’s a temporary glitch, Amnesty’s own Eyes on Syria project seems to have shut both of them…
“In the [Syria Non-Violence Movement] we believe that there is still a room for peaceful struggle and creativity amid all this chaos. Many people thought that the non-violence came to an end and this is a small step to show them that it is still there and they are using it or working with it on daily basis. So mainly it was to motivate people and the other aim is to document all these activities so interested people can have access to it easily.”
Taken together, these last maps say something about the courage of people’s convictions – and perhaps even the (I fear faint) possibility of cartographic convictions.


Pingback: Mapping Aleppo – and more | geographical imaginations
Pingback: A mile in these shoes | geographical imaginations
Pingback: A map that blogs | geographical imaginations