
The Heidelberg Institute for International Conflict Research has published its Conflict Barometer for 2013:
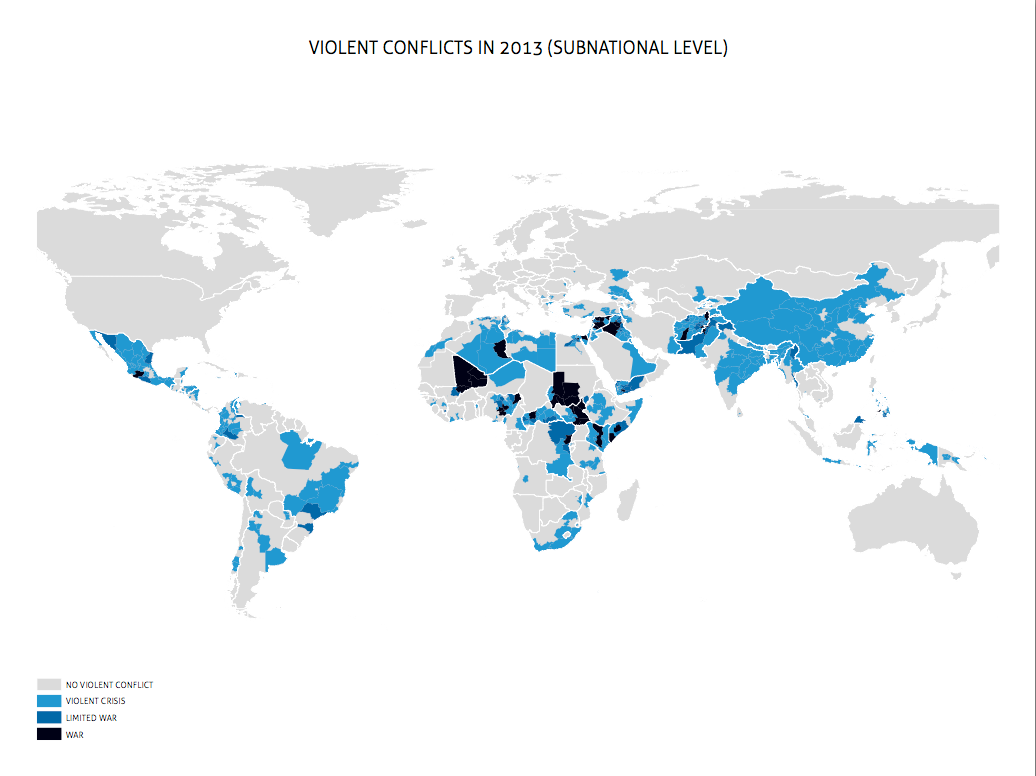
The full report can be downloaded here; it includes a detailed explanation of methodology and sources, many more maps, and a series of detailed regional surveys.
There are, of course, many other projects that attempt to monitor the macro-geography of armed conflict that also make their databases available for research, including the Correlates of War project (data from 1816 on), the Armed Conflict Dataset maintained by UCDP/PRIO (see also here; data from 1946 on) – both these are global – and the Armed Conflict Location & Event Data Project (ACLED) which provides a much more detailed, sub-regional mapping and claims to be ‘the most comprehensive public collection of political violence data for developing states.’ I’ve pasted an example of their sub-regional mapping below; the original is here, along with others for the DRC and Zimbabwe, while maps plotting the activities of Boko Haram, the Lord’s Resistance Army and other conflicts are available here and here.

I also greatly admire the Event Data on Conflict and Security (EDACS) produced by Sven Chojnacki and his colleagues in Berlin, and the disaggregated analyses they provide. Like ACLED, this also includes a remarkably detailed time-space analysis of violence in Somalia:

You can find out more about the project from the special issue of International Interactions 38: 4 (2012) on Event Data in the Study of Conflict.

Pingback: Peace in our time | geographical imaginations