Four years ago I described Project THOR (Theatre History of Operations Reports), Lt Col Jenns Robertson‘s remarkable attempt to transcribe, standardise and integrate the available records of US Air Force strike missions – see here (scroll down) and (especially) here.
His databases have now been incorporated into Defense Digital Service‘s data.mil, described as ‘an attempt in open defence data’: it’s also an experiment, which invites not only use but interaction and comment. You can now access the THOR databases – and find the backstory – here.
In 2006, Lt Col Jenns Robertson and his team in the Pentagon faced a daunting task. Every week, the Air Force’s Chief of Staff and other senior military officers would ask for the latest on the air war in Iraq and Afghanistan – how many aircraft had flown that week, which ground units they supported, and what munitions they had dropped.
Working in the Air Force’s Operations Directorate, Robertson had access to a wide array of classified data sources, yet the weekly report was tedious to produce. Data was not easily searched and often contained only half the picture, forcing Robertson’s team to assemble the report manually every week over the course of several days. He knew there was an easier way.
In his spare time, Robertson began creating the Theater History of Operations Reports (THOR), initially a simple Excel spreadsheet that eventually matured into the largest compilation of releasable U.S. air operations data in existence. Robertson tested his database with his team, asking them to generate the Chief’s weekly report twice — once manually, and again using THOR. The result was impressive: THOR cut the report work from three days to just under an hour.
After receiving Department of Defense approvals, Robertson was able to post THOR files online so interested public citizens could search the data for their own purposes. Robertson understands the vast potential benefits of opening such a large compilation of previously inaccessible data to the public. “I can’t envision all the ways this can be used”.
One of the first (once forbidden) fruits of releasing this data to the public is a remarkable map by Cooper Thomas plotting 3.1 million US bombing and ground attack missions (including Close Air Support and aerial interdiction) in North and South Vietnam, Laos and Cambodia between 1966 and 1974:
Cooper promises further explorations of this and other THOR databases; if you know of any others, please let me know [see UPDATE below].
Data.mil is promising to release a new ‘data story’ each month – next month should see the release of a military casualty database. The site went live in December 2016, and Mary Lazzeri and Major Aaron Capizzi explain the background:
Mary: Major Aaron Capizzi, USAF had the idea to use open data principles to solve Department of Defense (DoD) problems after attending a panel discussion at the Harvard Kennedy School sponsored by former Deputy CTO, Nick Sinai. In addition, I had been looking to seed an open data effort at DoD. Aaron’s idea, coupled with the opportunity to present the Theater History of Operations (THOR) bombing data in a new and interesting way, provided a perfect opportunity to put energy behind the effort.
We’re looking to use this pilot to jumpstart a larger open data effort at DoD. The beta site is a working proof-of-concept. The next step is to show the larger DoD community that open data merits investment.
Aaron: Our approach is unique in two ways. First, Data.mil will test various ways of sharing defense-related information, gauging public interest and potential value, while protecting security and privacy. We will quickly iterate and improve the data offerings on data.mil, using public feedback and internal department discussions to best unlock the value of defense data. Our goal is to provide all data with enough context that users, both the public and defense employees, can understand the potential value and get started using data quickly.
Second, Data.mil will prioritize opening data using a demand-driven model, focusing on quality rather than standard quantity metrics. The Department of Defense regularly reports on the significant challenges we face in defending the nation, which range from attracting talented recruits to developing game-changing technology within constrained budgets. Most of these aspects of defense business generate large amounts of unclassified data which, if released, can encourage collaboration and innovation with public and private sector partners.
Mary: The site is built using an open data storytelling platform, LiveStories. Rather than simply posting a list of datasets, the goal of Data.mil is to tell stories with data. The site provides narratives to complement the data so users can more quickly understand and begin using it. LiveStories was selected for its visualization and data analysis features allowing us to present an engaging site for its users. In addition, it’s easy to use. Non-technical staff can use the platform to share their data and tell their stories.
We want to compel collaboration from military components, industry partners and the public. The partnership with data.world enables that collaboration providing the social media tools to support exploration and a community discussion of the data.
Conversely, it’s also worth thinking about how digital platforms are now used to plan and execute air strikes. As the origins of Project THOR show, there are crucial links between retrospective reporting and prospective mission planning.
UPDATE: I’ve since discovered this map of Allied bombing raids over Europe in the Second World War by Dimitri Lozeve, also drawn from Data.mil’s THOR database (click on the link for an enlarged version):
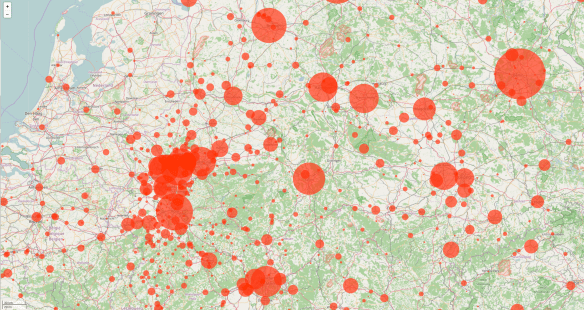
You can zoom in; here are two close-ups:
The map comes without a key; all I know is that the original tabulations include ‘U.S. and Royal Air Force data, as well as some Australian, New Zealand and South African air force mission’ 1939-1945 and refer to tonnages dropped: more discussion here.
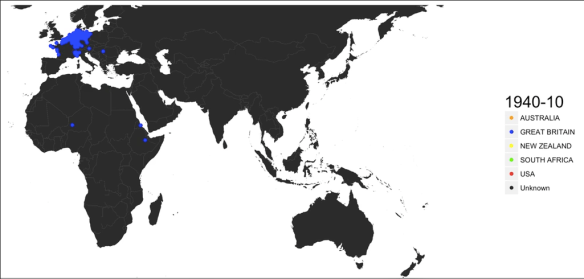
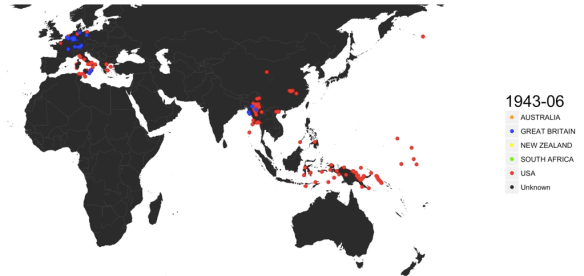
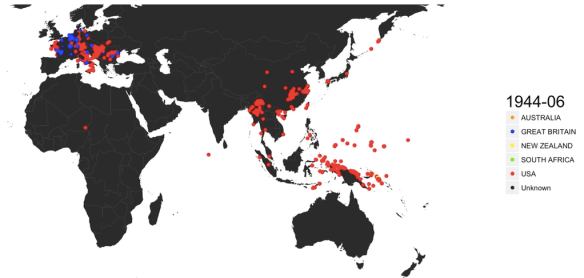
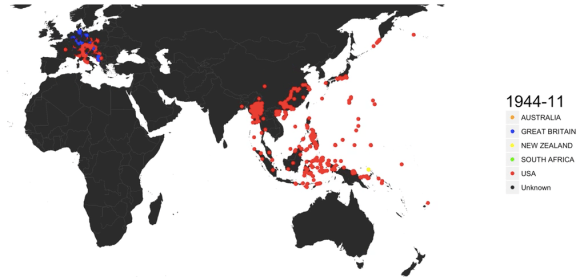
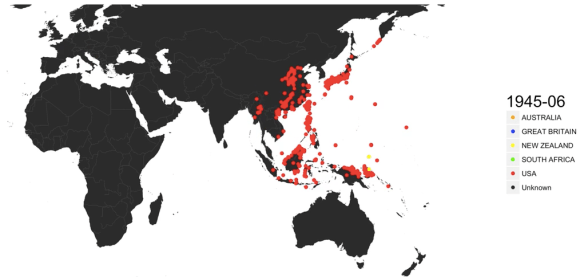
On the global scale, Data Is Beautiful has a GIF showing ‘every bomb dropped by Allied forces in World War II); you can view it as a video here, from which I’ve grabbed these screenshots that capture the shift from the European to the Pacific theatre:
Data World‘s Ian Greenleigh has kindly alerted me to a similar treatment of the THOR database for Vietnam by his colleague Mark DiMarco here:
Our point-of-view is from high above the South China Sea, where much of the US Navy fleet was stationed.
By giving the user a bird’s eye view, we can clearly see up and down the Vietnamese peninsula, and the neighboring countries of Laos & Cambodia, and precisely see where these missions took place.
Each frame of the visualization is a single day’s worth of missions. Some days had as many as 1,500 missions, while the records for some days are completely missing.
The colors of each of the circles dictates what type of mission took place.
The GIF is here; screenshot from the interactive:


